Lord.
Anyway, not been updating this much since there's not been much action, but I thought I'd revisit the season by season correlation between MLS and the Premier League with a few free minutes.
I should note that this is all based on final standings, since MLS crowns our Champions sort of weird (not better or worse, just differently) when compared to the rest of the world.
One thing I do enjoy about the way we do it here is that in any given year you may just have yourself a good home team to watch. Unless you live in Toronto. Or anywhere in Canada, really.
Conversely, Premier League teams tend to generally find a way to stay in the same position as before. You could certainly argue that that sort of league structure makes upsets that much more compelling, and watching "super clubs" a la the Big4/5/6/whatever makes for the most exciting matches, but there's really something to me about the whole "any one can win any game on any given day".
So the question is, can we quanity that?
The answer is, of course, "Yup." With pages and pages of "buts..."
But we're not gonna get into buts here. Unless that's your thing.....
I digress.
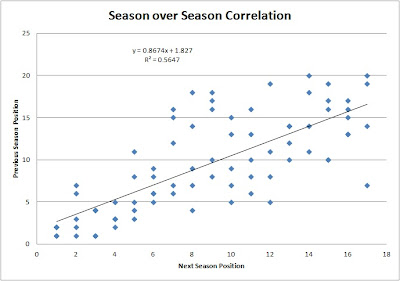
I looked at the 2007, 2008, 2009, 2010, 2011 and 2012 MLS seasons for MLS season-to-season correlation. That is, how well did your performance last year predict your performance for the following year. In a word? Not good. Interestingly though, the 2011 season had a very strong correlation to the 2010 season, with an R value of 0.70. The next highest was 2009 to 2008 at 0.54. The average correlation was 0.38, but average isn't a great way to do it. Instead, I lumped all the seasons together into one data set to come up with a total correlation value. That value was 0.41. That's not very good correlation. I'd note I did throw out inaguarl years for expansion teams, but that should be a given.
In contrast, the Premier League has excellent correlation. Teams generally may move up or down two or three places over the course of a year, but, in general, where you finished last season is a pretty good indicator of how you'll finish this season.
For the Premier League I looked at 2006-2007, 2007-2008, 2008-2009, 2009-2010, 2010-2011, and 2011-2012, throwing out single data points for promoted/relegated teams. Interestingly, correlation seems to be increasing since 2006-2007. The lowest R value of 0.65 occured that year, and has increased in every season since, up to a value of 0.86 for 2011-2012. Could more money be "locking in" teams as player wage wars serve to stratify the league into the Haves and Have-Nots?
Anyway, these numbers might not make much sense, so here's the plotted data sets for both leagues. It's pretty obvious that in MLS, the results are all over the place, whereas in the Premier League, things look very linear.
MLS Correlation
Premiership Correlation
And... that's all I have to say about that...

