Catching up again, I Swear.
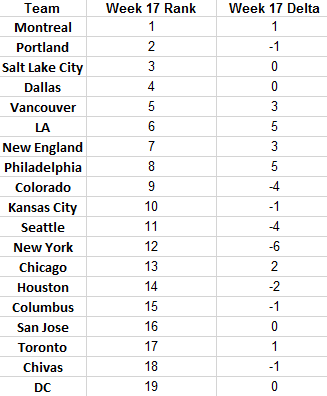
Okay, so this is NOT the most recent power rankings to reflect games from this weekend, this is everything up through the weekend before last. I'm not skipping it because rankings are dependent on past results, so I would need to update the spreadsheet anyway, and it's trivial to add the rankings and graphics once that's all done. So, without further adu (not a Freddy joke) here it is.
Lots of weird movement in the middle this week. I think callups and the like made things screwy, combined with a more dynamic model and a lot of teams seemingly unable to figure out how they want to play this season.
Table.
Graph.
That is all.
A lazy soccer blog that mostly deals with trying to use some actual data and do some real analysis instead of gut feeling type stuff. Of course in the end it's all arbitrary any ways, so it's really pointless. I just like playing with data in excel really.
Showing posts with label soccer analysis. Show all posts
Monday, July 1, 2013
Saturday, June 22, 2013
Sleep when youre dead, which may be soon...
Okay, getting caught up again. Numbers through June 19th. No commentary other than whoever said that having your second kid is easier than having your first needs to get punched in the dick until they're infertile. Movement might look a little screwy given the weird scheduling. Next week may not be better...
Anyway, rankings...
Anyway, rankings...
Graph.
I'm going to bed.
Tuesday, May 14, 2013
I did what I swore I wouldn't...
So I told myself this season I was going to stick with the same methodology that I started with. And I thought I really meant it. But then I came up with something better. So I'm changing. I'm sorry. It's not you, it's me. Or something.
While the system had been working pretty well so far, it still didn't seem to capture 'momentum' shifts all that well. However, Itried to compensate that with adding a Flavor of the Week ranking syste. I've ultimatly decided that the 'mashup' system, using both systems and then combining the rankings, was probably the best, and when comparing it to how other sites rank teams, it looks like it's doing a better job.
Remember, these are still purely numerical, data driven rankings, that don't hvae any input from me other than results. I think it's become a very good way to creating "power rankings" that mirror what "experts" are saying and is backed up by results and not just hand waving mumbo jumbo.
Anyway, enough exposition. Let's check the numbers.
I'd note that I also did back calculate "mashup" rankings for each team over the course of the season. This will do away with the need for some of the extraneous info I had been providing earlier. From now on it'll just be teams rankings and movemnet form the last week and a chart showing ranking position over the course of the season.
Numbers. Yes. Here.
Dallas still at the top, New York with a big jump, and both LA teams with big falls (poor Chivas ;/ ).
Here's the graph for the full season. Check out Vancouver. What a crazy poor season they've had... Click to embiggen, I'm trying to go with a .png to see if that makes it prettier.
Annnnd... that's all I have to say about that. More fun next week. Until then... courage.
While the system had been working pretty well so far, it still didn't seem to capture 'momentum' shifts all that well. However, Itried to compensate that with adding a Flavor of the Week ranking syste. I've ultimatly decided that the 'mashup' system, using both systems and then combining the rankings, was probably the best, and when comparing it to how other sites rank teams, it looks like it's doing a better job.
Remember, these are still purely numerical, data driven rankings, that don't hvae any input from me other than results. I think it's become a very good way to creating "power rankings" that mirror what "experts" are saying and is backed up by results and not just hand waving mumbo jumbo.
Anyway, enough exposition. Let's check the numbers.
I'd note that I also did back calculate "mashup" rankings for each team over the course of the season. This will do away with the need for some of the extraneous info I had been providing earlier. From now on it'll just be teams rankings and movemnet form the last week and a chart showing ranking position over the course of the season.
Numbers. Yes. Here.
Dallas still at the top, New York with a big jump, and both LA teams with big falls (poor Chivas ;/ ).
Here's the graph for the full season. Check out Vancouver. What a crazy poor season they've had... Click to embiggen, I'm trying to go with a .png to see if that makes it prettier.
Subscribe to:
Posts (Atom)


